
Introduction
Intensive livestock production methods are the dominant system of livestock farming. Today, farmed poultry makes up 70% of all birds on the planet, and 60% of all mammals on Earth are livestock, namely cattle and pigs (Yinon M. B. et al., 2018). This trend is increasing: many Asian countries, including China, consolidate farming operations to reduce fragmentation and increase production efficiencies (Global Meat News 2018).
Combine this growth in intensive livestock production with current forecasts for global population rise, increasing urbanisation, and a burgeoning middle class that demands more animal protein. It seems that meat, dairy and aquaculture companies are favourably positioned for capital investment. However, the dramatic expansion of this industry has also exacerbated climate change impacts, water scarcity, food insecurity, biodiversity loss and antimicrobial resistance (AMR). In a resource-constrained world, there is growing recognition of the inefficiencies of meat and dairy production. An analysis found that the production of animal-based foods accounted for more than three-quarters of global agricultural land use and around two-thirds of agriculture’s production-related greenhouse gas emissions in 2009, while only contributing 37% of total protein consumed by people in that year (World Resources Institute, 2016). These externalities are not only incompatible with the Sustainable Development Goals (SDGs), but they also present risks to capital investment.
In 2016, FAIRR’s flagship report for investors, ‘Factory Farming: Assessing Investment Risks’, identified 28 ESG risks linked to the livestock sector. The Coller FAIRR Protein Producer Index builds on this work by analysing major protein producers on their management and disclosure of nine of the most critical risks facing the industry. As these companies are some of the largest publicly listed meat, dairy and aquaculture producers, most institutional investors have exposure to these producers within their equity and fixed income portfolios. The Index enables a better understanding of the ESG risks facing global listed protein producers and helps investors better integrate this data into the investment decision-making process.
The Index will provide valuable information to the market on best practice in the management of these key ESG risks. Equally, we anticipate that it will encourage companies to establish the policies and processes required to improve oversight and performance across each issue.
Distribution, Approach and Limitations
About the Coller FAIRR Protein Producer Index
The Coller FAIRR Protein Producer Index is the world’s first comprehensive assessment of how some of the largest global intensive livestock and fish farming companies (by market capitalisation) are managing critical risks facing the sector.
The animal and fish production industry remains poorly scrutinised relative to the broader food industry. For instance, the livestock industry is under-represented within most global benchmarks, even if it is among the most over-exposed in terms of risks. Fewer than 25% of the companies in our Index are invited to participate in the Dow Jones Corporate Sustainability Assessment or represented in CDP’s (formerly Carbon Disclosure Project) risk databases.
As a result of this lack of scrutiny, the scope of this Index focuses on companies primarily involved in breeding, processing, distributing and selling meat, dairy and/or aquaculture products, rather than food manufacturers or retailers. The 60 Index companies have a combined market capitalisation of $297 billion. Almost all of their $300 billion worth of revenues are derived from producing and processing intensively farmed livestock and fish.
These companies play a significant role in meeting and building consumer demand for animal proteins. Their consolidated revenues cover approximately 20% of the global livestock and aquaculture market. They dominate their regional markets: the 16 Chinese companies in the Index, for example, represent nearly 30% of the Chinese market for animal proteins, including 100% of the domestic dairy market. They also supply some of the world’s biggest food companies, including McDonald’s, Walmart, Nestlé and Danone.
Regional and protein distribution
More than half (52%) of companies in the Index are based in Asia, including 16 companies located in China. The concentration in Asia is significant, given the forecast growth in consumption of animal protein in the region. Inner Mongolia Yili Industrial Group, a China-based dairy producer, has the largest market capitalisation in the Index at $27 billion (as of 28 March 2018). Brazilian meat conglomerate JBS has the largest revenues at $52 billion (based on 2017 filings).
The 60 companies have material exposure to five main animal protein categories: beef, dairy, pork, poultry and eggs, and farmed fish. However, companies with poultry supply chains have the largest representation, at 43% of the Index. See the full list of companies in Appendix 1.
Risk factors and key performance indicators
We use three primary approaches to identify nine material risk factors and key performance indicators (KPIs) for the intensive livestock farming industry:
Previous FAIRR assessment: FAIRR’s analysis of the 28 risks linked to intensive livestock production systems in 2016, based on detailed and extensive consultation with a range of investors, experts and industry groups.
Top-down analysis: We review seven top-down analyses by investor groups and non-governmental organisations (NGOs) to determine overlapping risk factors.
Bottom-up analysis: We identify risk factors and KPIs that are currently acknowledged in public filings by a representative sample of companies. We work on the assumption that disclosure is a proxy for companies’ focus on these issues.
The resulting framework, on the next page, facilitates benchmarking of the companies across risks that are widely recognised as meaningful for both the companies and their stakeholders.
Limitations
Given the Index’s global diversity and the general lack of transparency in the animal protein sector, we see these risk factors and indicators as only the first step towards assessing the sector’s management of its most material risks. For example, a key risk for the industry is growing awareness of the causal link between high meat consumption and non-communicable diseases such as cancer, diabetes and obesity. However, the Index does not consider health issues as part of its current risk framework, beyond an assessment of company exposure to alternative proteins.
This is primarily because health and nutrition issues are complex and dependent on local culture and social contexts. There is currently no standardised framework for assessing animal protein consumption in the context of health.
In addition, the methodology of this pilot Index primarily assesses company policies and disclosure rather than performance. We believe the development of robust policies and management of the risk factors assessed is the first step for companies in this sector, which, as we have identified, are lagging behind the broader food industry on these issues. However, we acknowledge that this approach is not entirely reflective of the effectiveness of a company’s approach or of company performance.
Our aim is to work with stakeholders to ensure that the framework continues to evolve with time, so it remains both comprehensive and meaningful for investors and sector companies.
Data assessment and scoring
The FAIRR team conducted company assessments using publicly available information. This included company websites and reports, CDP disclosures, and news articles. Unless indicated otherwise, all assessed data and revenues stated in this report are as of 31 March 2018. All market capitalisation figures are correct as of 28 March 2018.
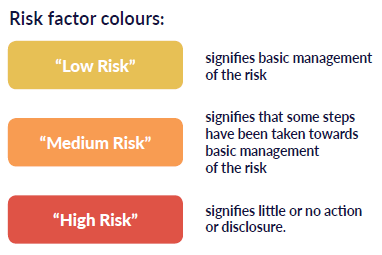
We assigned companies and rated them on a scale of 0–5 based on their commitments, policies and disclosure against relevant KPIs. The final company score is an average of scores across all KPIs and risk factors (out of 100). A high score indicates better disclosure and management, and thus lower risk. For this iteration of the pilot Index, all risk factors and KPIs are weighted equally.