Global efforts to curb biodiversity loss and climate change have highlighted a severe shortage in actionable sustainability data. On-site measurements of environmental variables, crucial to assess localised impacts and precisely attribute responsibilities, remain time-consuming and resource intensive. If we are to address the climate and biodiversity crisis, our attention must turn to solutions that are viable at scale. Moreover, the paucity of third-party-validated sustainability data from companies is yet another critical issue. How could governments ever implement the necessary taxes and regulations without specific and credible enough data? When action is sorely needed, we welcome any solution that may help governments, investors and society at large hold companies accountable for all material externalities.
Fortunately, the growing market of geospatial data and artificial intelligence marks a potential turning point in ESG and sustainability by paving the way for new data collection and production methods. Compounded by more significant regulatory pressure (cf. the anti-deforestation law voted by the EU parliament yesterday), we hope these innovations will accelerate environmental action by bridging the gap between reality and reporting. First, corporate disclosure will no longer be the cornerstone of sustainability and ESG data. Second, the potential for this technology to supply independent, up-to-date, and granular data about environmental variables may prove to be instrumental in our efforts to avert the climate and biodiversity crisis.
Gathering Data
The idea behind a geospatial database (i.e., geographic information systems or GIS) is all about obtaining location-enriched data. We outline the data-collection process below in three steps:
Gathering asset-level data regarding the location, type and ownership of the particular asset that one wishes to monitor (e.g., a mega-farm supplying processing facilities owned by JBS, located at a specific latitude and longitude).
Comparing asset data with observational data (e.g., methane emissions measured by remote sensors).
Using data processing tools (e.g., Machine Learning) to combine these two data points and draw insights into an asset’s environmental impact (JBS’s cattle farms in the Mato Grosso emit X amount of CH4).
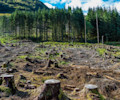
Five index companies disclose already using geospatial monitoring technology to monitor deforestation within their supply chains for the following commodities. Source: FAIRR, 2021
If geospatial technology can provide such valuable insights, why has it taken so long for financial actors to employ it? For over half a century, geospatial data has played a pivotal role in the screening and monitoring processes of insurance companies and government agencies. Still, since then, technological advancements have allowed for a genuine democratisation of this technology across the public and private sectors.
Satellites are an excellent illustration of this. Approximately 1,000 active satellites were orbiting the earth in 2010. Today, more than 4,800 are in orbit (and yes, we can thank Elon Musk’s Starlink for this, in part). Yet as the quantity increased, so too did the quality. Take Sentinel-1A, for example, which at the time of its launch in 2013 was recognised as the trailblazer of the “new era of Earth observation”. With a spatial resolution of about five meters, Sentinel-1A outclassed most of its peers in imaging technology for non-military applications. Today, earth observation companies such as Planet Labs are launching satellites with spatial resolutions of up to 30cm (meaning that one pixel on an image represents 30 square centimetres on the ground) and much higher revisit frequencies (i.e. the number of times an image is captured).
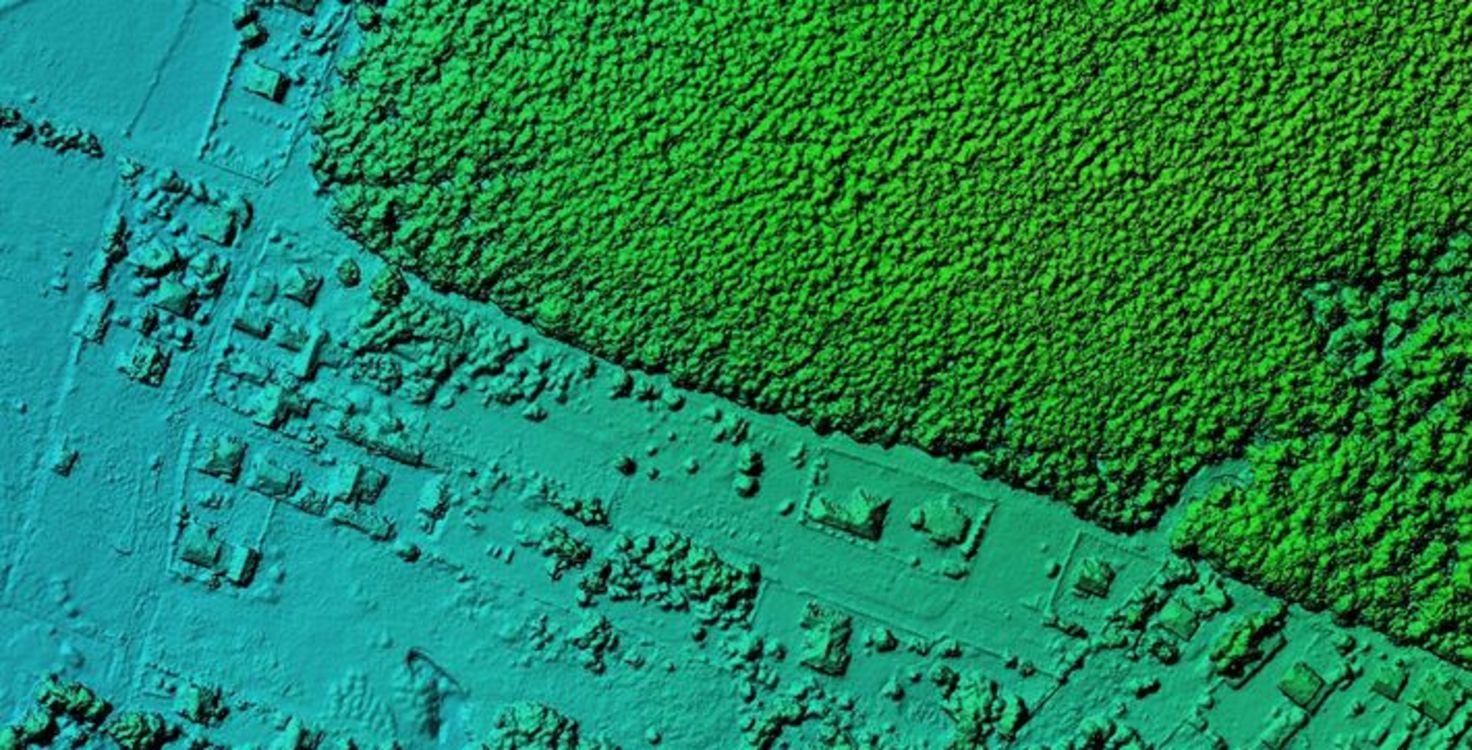
Another remote sensing technology that offers promising results is light detection and range (LiDAR). It uses laser beams to measure the distance between objects and recreate a 3D projection of the space. Self-driving cars, for example, use LiDAR to determine the relative distance to other cars. In the context of environmental science, however, it can be used by drones to create accurate topographical data of the land. For example, forest management firms have already started using LiDAR to measure canopy growth over time and estimate carbon storage and sequestration levels.
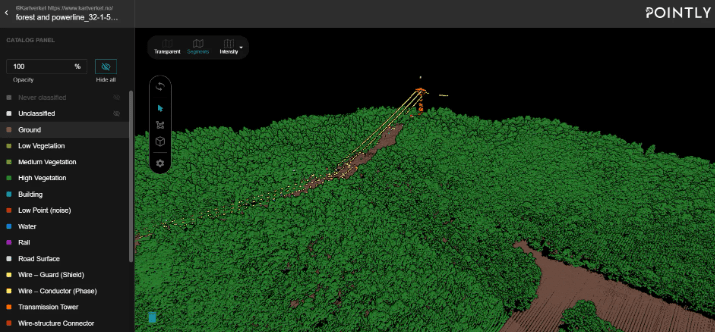
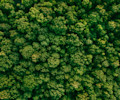
Combining AI and LiDAR surveying can provide valuable insight into forest growth, density and evolution over time. Source: Francie Kastl, Automated Point Cloud Analysis, GIS Resources
These are just two examples of how real-time data can be harnessed on a near-global scale to generate accurate environmental data. Therefore, it should be no surprise that the global geospatial analytics market is expected to reach a value of over $126 billion over the next six years. While remote sensing continues to improve methods of data capture, it has also highlighted the need to improve methods of geospatial data review and analysis.
Scaling-Up with AI
The increasing use of remote sensing technology can be attributed to advancements in artificial intelligence and machine learning. Where a human analyst might have spent days, if not weeks, manually processing datasets and sensor readings, machine learning algorithms can do it in a matter of seconds while identifying anomalies, patterns and valuable insights in the data. Combining GIS with AI has led to companies and services offering a range of new analytical tools, as outlined below.
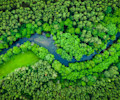
How to create an algorithm that can predict which rivers are at risk of eutrophication:
Step 1. Collect & Prepare
Create one dataset containing as many pictures of rivers as possible, which you know from ground analysis are eutrophic, and another set containing images of normal, healthy rivers. Prepare the data and your image-recognition ML algorithm.
Step 2. Identify Patterns
The algorithm will “train” itself by identifying which features need to be assessed (e.g., if it sees algal blooms, the river is probably polluted. If not, the river is probably healthy).
Step 3. Evaluate
Using unseen data, test whether the algorithm can detect the health of rivers accurately.
Step 4. Parameter Tuning
Based on how accurate the results are, you may have to tune the nature and weight attributed to each variable used by the algorithm to make predictions. For example, you may decide that polluted rivers do not always have green algal blooms, but any polluted river is always situated in well-lit areas; hence, you adjust the weight to give that second feature greater importance.
Step 5. Predict
Finally, after more testing, the model should be able to predict which rivers are polluted and which are not, as well as the respective level of nitrogen pollution of each (assuming that you have an image of it) without requiring laborious on-site measurements
Real-World Applications
Here is a glimpse at the current landscape of open and commercial geospatial data platforms:
Kayrros: Offers geospatial data for a variety of applications. Some examples include:
Biomass Watch: Combining artificial intelligence with satellite imagery to recreate a 3D version of forests. This helps calculate vegetation density and growth, providing accurate proxies for estimating the carbon capture potentials of forests and the levels of biodiversity.
Methane Watch: Uses the ESA’s network of sentinel satellites and applies proprietary AI models to determine onshore methane hotspots and leakages. Lobelia: Global environmental insights, such as coastal erosion, air pollution and drought risk. Using its soil moisture tracker,
Lobelia partnered with the Food and Agriculture Organization (FAO) to develop an early warning system for desert locusts, helping predict outbreaks based on Soil Moisture (since female locusts lay their eggs in moist substrates).
Kumi Analytics: The company focused initially on economic forecasting for financial institutions but has now developed an environmental application, with a proof of concept being provided to the Singaporean government’s Emerging Stronger Taskforce (EST) on green finance. It could, therefore, integrate its interest in protecting the environment with remote sensing and helping financial service providers scale their businesses with location intelligence.
Climate Trace: Partly funded by Google and leading efforts to measure anthropogenic GHG emissions as they happen, including scope three emissions using satellite data and machine learning models.
Global Fishing Watch: Also funded by Google, it uses a complex algorithm applied to public data to track fishing behaviour (e.g. trawling) and detect illegal fishing in marine protected areas.
Global Forest Watch: The initiative has partnered with Orbital Insight, an AI-powered geospatial analytics platform, to create a map of the earth’s forests using sophisticated algorithms to identify forests worldwide.
Geo-financial Analytics: Leverage satellite technology to measure methane emissions of energy producers (US & Global) to allow for comparison between satellite-measured and company self-reported methane emissions.
Room for Improvement
Despite all the exciting opportunities geospatial finance offers, it still faces many barriers to becoming a silver bullet. We outline some of these below:
Unravelling asset and supply chain data: Only a tiny fraction of asset-level data is publicly available. Broader applications of this technology will require more significant efforts to create accurate geo-located company trees. The challenge becomes more complex in sectors like agriculture and retail, where supply chains are notoriously opaque. One initiative attempting to bridge the asset-data gap in the context of deforestation is Trase Finance: launched by Global Canopy, the Stockholm Environment Institute and Neural Alpha.
Training machine learning models still require large datasets of ground-level data.
Biodiversity is still extremely difficult to capture and quantify: A ton of carbon is relatively straightforward, but we have no equivalent ‘unit’ for biodiversity. Additionally, species can be hidden (below vegetation or in the soil) or more at risk of extinction than others (you would not compare a boar to an endangered black rhino). Furthermore, uncertainties caused by tipping points and non-linear responses between species and their ecosystem pose a major challenge to accurately quantifying biodiversity.
Geospatial technologies and AI are emerging as true catalysts of change. In the global fight against the climate and biodiversity crisis, we must have greater insights into the dynamic links between business and nature. Although obstacles exist to the widespread deployment of these technologies, they will bring unprecedented opportunities to sustainability data. For the ESG field, they will promote greater transparency, accountability and accurate impact metrics. For society at large, it means a much-improved environmental data portfolio with more frequent and cost-efficient methods of monitoring the environment.
FAIRR insights are written by FAIRR team members and occasionally co-authored with guest contributors. The authors write in their individual capacity and do not necessarily represent the FAIRR view.
Written by